Dashboards & Reporting

Dashboards that show what's actually happening in your business.

Most owners don't need more data, they need a clearer view of the data they already have. We build focused dashboards that pull together jobs, sales, customers, bookings, or operations into a single screen you'll actually look at, in plain language and without the spreadsheet acrobatics.

Mockup of an operations dashboard with KPI cards, weekly bar chart, and today's schedule.

Who this is for

  • Owners who want a clear view of the business without opening five tools
  • Managers tracking jobs, bookings, or staff performance week to week
  • Teams that already collect data but can't easily see what it means
  • Businesses outgrowing the 'monthly spreadsheet export' habit

Problems we typically solve

  • Numbers live in separate tools, your CRM, accounting app, booking system, and spreadsheets
  • The 'monthly report' takes hours to assemble and is out of date the moment it's finished
  • There's no shared view of what's happening this week
  • Off-the-shelf BI tools are overkill and require a specialist to maintain

Example use cases

A few of the kinds of projects this service typically covers. Yours will look different, these are conceptual, to give a sense of scope.

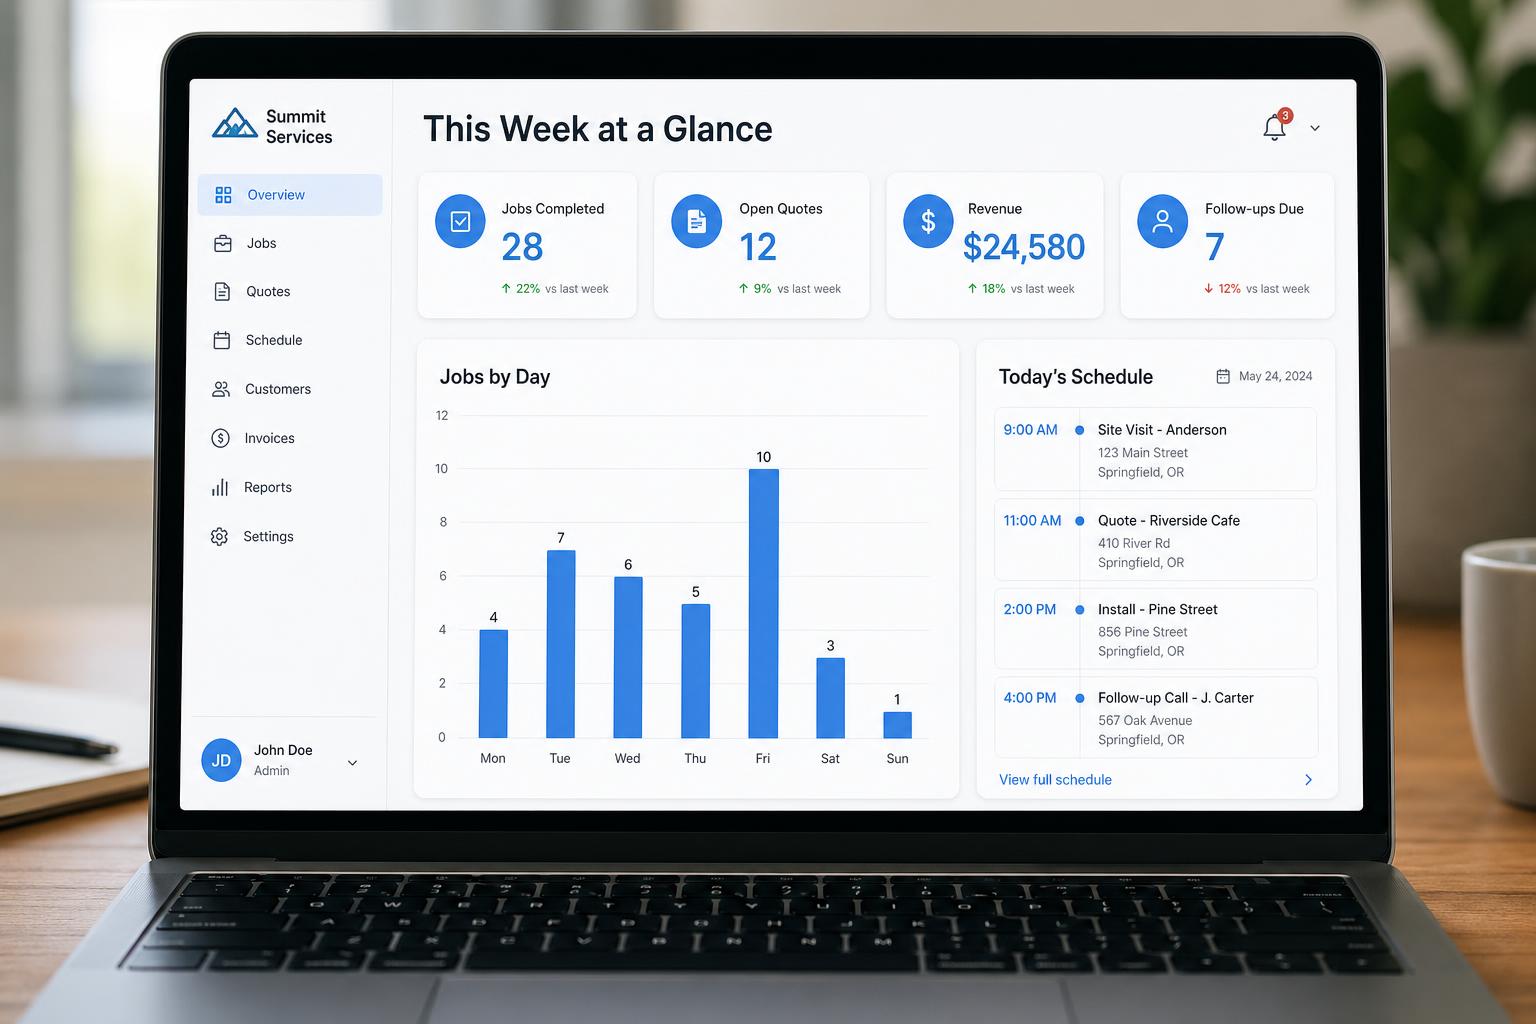
Operations dashboard for a service business

Today's jobs, this week's bookings, open quotes, follow-ups due, and revenue at a glance.

Sales pipeline overview

Leads by stage, conversion, average time to close, and follow-ups overdue, without exporting anything.

Inventory and order dashboard

Stock levels, reorder points, incoming shipments, and slow-movers in one view.

Owner's weekly view

A single screen designed for the owner: this week, last week, what needs attention.

What's included

  • A discovery session to identify what you actually want to see, and what you don't
  • Clean, focused screens with the most important numbers first
  • Filters by date, team, service, or whatever matters to you
  • Connections to your existing data sources where practical
  • Mobile-friendly view for owners and managers on the move
  • Sensible refresh intervals so the data is current without overloading anything
  • Role-based access so the right people see the right numbers

How a dashboard project runs

  1. 1

    Discovery

    A short conversation about what you're trying to fix, who will use it, and what the current workflow looks like.

  2. 2

    Plan

    We map the screens, data, and main features for the first version, and agree on what's in scope and what's not.

  3. 3

    Build

    We build using a fast, modern workflow with human review and testing at each step.

  4. 4

    Review

    You try it with real data. We refine layout, wording, forms, and flow until it feels right.

  5. 5

    Launch & improve

    We help you launch, then improve based on how the tool is actually being used.

Frequently asked questions

Tell us what you want to fix, build, or improve.

A short conversation goes a long way. Share what's slowing you down, we'll suggest a practical first step.